Improve Energy Performance: Measurement and Verification – Part 2 of 3
January 4, 2021Continuing from our previous blog and finalising our discussion on measurement and verification (M&V), with two other M&V issues.
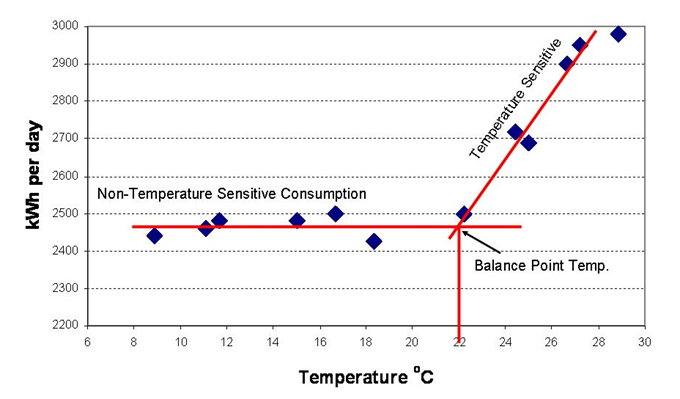
Cooling and Heating Degree Days: As part of the adjustments the regression analysis may also include Cooling Degree days (CDD) and Heating Degree Days (HDD). CDD are a simplified measure of how much cooling is likely for a building. CDD may be approximately proportional to the energy used for cooling a building. In general, daily CDD are the differences between the building balance point and the average outside temperature.
CDD are calculated for each day and then summed over a month or year. The balance point for CDD is the temperature point where the building’s cooling air-conditioning system operates. The balance point may also be illustrated as in the graph below (Abraxas Energy: www.abraxasenergy.com). HDD is the converse of CDD and may be approximately proportional to the energy used for heating a building. The building’s balance point for HDD may be different to CDD.
Reference: www.abraxasenergy.com
Uncertainty: The objective of M&V is to reliably determine energy savings. Uncertainty assessment for IPMVP (https://evo-world.org/images/denisdocuments/Uncertainty_2019_TOC.pdf), provides guidance on quantifying the uncertainties created by the modelling, sampling and measurement errors. Statistics provide ways of checking results to see if the reported savings are ‘significant’ and likely to be an outcome of the Energy Conservation Measure (ECM) or if due to random behaviour. For example:
- R2 : ‘Goodness of Fit’, where 0 is no correlation, 1 is perfect and 0.75 and above is deemed acceptable.
- Coefficient of Variation, which represents the data’s variation from the regression line, with less than 5% acceptable.
- Baseline Bias check, which needs to be within 0 < = 0.005% (ASHRAE)
- ‘t’ statistic for each variable, where significance is more than 2.
M&V is the process of using measurements to reliably determine actual savings and simply provides proof of the effectiveness of energy management. Central to proper savings determination and the basis for verification is a comprehensive M&V plan as outlined in the IPMVP. Before undertaking any energy or water saving improvement activity there is a need to design the M&V process, gather baseline information and document all in a comprehensive M&V plan. After the improvement is completed there is a need to verify the measuring equipment, gather the reporting data and determine the savings as defined in the M&V plan.
For further reading and references:
- Energy Manager’s Introduction to Weather Normalisation of Utility Bills. Abraxas Energy Consulting. Website: www.abraxasenergy.com
- Fundamentals of Measurement & Verification Educational Programs. The Association of Energy Engineers (AEE), USA. Website: www.aeecenter.org
- International Performance Measurement and Verification Protocol (IPMVP 2012): : https://evo-world.org/en/products-services-mainmenu-en/protocols/ipmvp
- Concepts and Options for Determining Energy and Water Savings Volume 1. Prepared by Efficiency Valuation Organisation. Website: www.evo-world.org and https://evo-world.org/images/denisdocuments/Uncertainty_2019_TOC.pdf
Please contact Susmet to assess your Measurement and Verification program.
Disclaimer:
This blog is part of a continuing series discussing sustainability and energy management issues. Contributions featuring achievements, techniques, products, and processes are welcome. Please feel free to contact Susmet to suggest ideas on future issues.
Whilst every effort is made to see that no inaccurate or misleading data, opinion or statement appears in this blog, Susmet accepts no responsibility or liability whatsoever for the consequences of any such inaccurate or misleading data, opinion, or statement.