Financial Sustainability: Improve business opportunities with Power Factor Optimisation
October 31, 2020Improve Energy Performance: “What gets measured, gets done”
December 2, 2020Continuing from our previous blog, a diverse “multi-path” approach is required for energy management to reduce energy, greenhouse gas emissions and operating costs. Two of the paths previously suggested include measuring energy efficiency between diverse premises (benchmarking) and the five-steps to successful energy management. This discussion and the next blog look at building load duration plots or building power signatures and benchmarking to help in reducing energy costs. Remember “What gets measured, gets done”.
Load Duration Plot or Building Power Signature
Electricity annual consumption patterns or ‘signatures’ for premises and buildings may be useful in comparing performance between time periods and between energy users.
The following two commercial building signatures indicate consumption over 12 months or 8760 hours each year. Building 1 (peak or maximum demand 290 kW) is a typical commercial gas-heated office building, operating 10 hours each business day, say 2300 hours each year. Building 2 (peak or maximum demand 350 kW) is an electrically heated building with substantial 24-hour data processing activities all year.

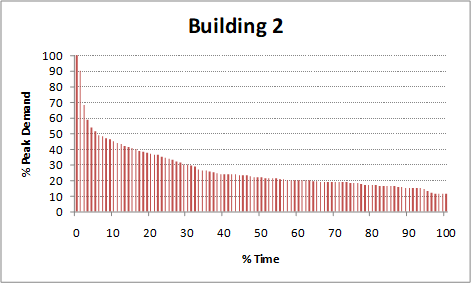
The vertical axis comprises the percentage peak or maximum demand reached in the year. The horizontal axis comprises the percentage time over the 12-months or the 8760 hours in the year, that the demand has occurred.
You may notice the difference between the buildings and their impact on electricity consumption (EI), electricity demand (DI), load factor and off-peak electricity. More on these indices in the next blog.
Different shapes or signatures reflect building operations and their energy-efficiency and allows a visual comparison. I suggest a target energy-efficient building signature is the dotted profile in Building 1.
From our range of experience, you will be able to compare energy-efficient building signatures across different buildings but with similar operations. Please contact Susmet to assess proper energy-efficient building signatures across your sites.
Disclaimer:
This blog is part of a continuing series discussing sustainability and energy management issues. Contributions featuring achievements, techniques, products, and processes are welcome. Please feel free to contact Susmet to suggest ideas on future issues.
Whilst every effort is made to see that no inaccurate or misleading data, opinion or statement appears in this blog, Susmet accepts no responsibility or liability whatsoever for the consequences of any such inaccurate or misleading data, opinion, or statement.